To succeed in trading, it’s important to make informed decisions based on technical analysis, fundamental events, or a combination of both. You should also consider your individual temperament and determine if you’re a short-term, intermediate-term, or long-term trader. Practicing strong technical analysis can increase your chances of success. Keep in mind that when holding positions for longer periods, you should be prepared to take on more risk to handle market fluctuations.
WHY is technical analysis important?
Understanding technical analysis is crucial in trading as it allows you to track market movements, price trends, and historical data. The market can change swiftly due to various factors such as unexpected interest rate changes or political unrest in energy-producing countries. Knowing the critical technical areas in the market can help you manage your risks and react appropriately to these changes. It’s often said that “the trend is your friend,” and technical analysis can help identify trends and time your trades. Timing your trades successfully can lead to improved psychological discipline, making you a more successful trader.
WHAT are charts?
Charts display historical market data in a graphical format and can be viewed on both short- and long-term bases. These charts are available at various intervals such as intraday, daily, weekly, and monthly. Short-term traders analyze market data using shorter intervals, while longer-term traders use longer intervals. However, all traders can gain market perspective by using a variety of time frames. The Meta Trader Platform offers bar, line, and candlestick charts, which are the most common types of charts.
WHEN do you use charts?
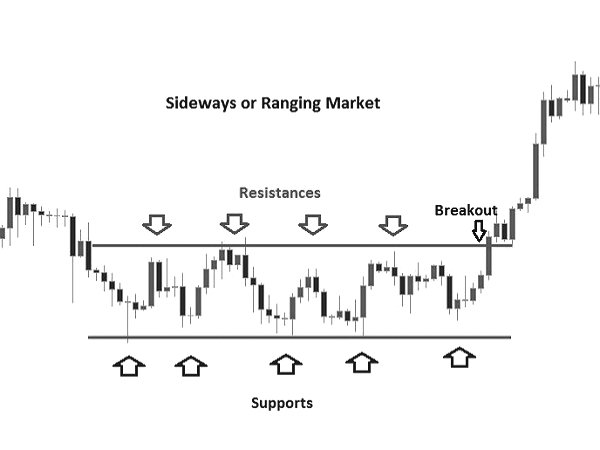
Many traders use technical analysis to determine the best time to enter or exit a trade. One commonly used strategy is placing a buy stop above the market’s resistance lines to enter and a sell stop below support lines to exit. By gaining a deeper understanding of technical analysis, you can make more informed decisions about whether to hold onto or sell trades.
Line chart photo from google
Candlestick Chart A candlestick chart uses color to help quickly identify upward or downward momentum in the chosen period. The period’s range is marked by the length of the entire candle. The “body” of the candle marks the trading range between the open and closing price, and typically is colored green when the close is higher than the open and red when the close is lower than the open. The lines outside the body are known as wicks or shadows.
Bar chart photo from google
Line Chart A line chart tracks only one of the variables (open, high, low, close) of the chosen period.
Bar Chart
A bar chart uses a single, vertical line to mark the trading range of the period, be it intraday, daily or longer. A hash mark to the left signifies the opening price; a hash mark to the right is the closing price.
Please enter CoinGecko Free Api Key to get this plugin works.